
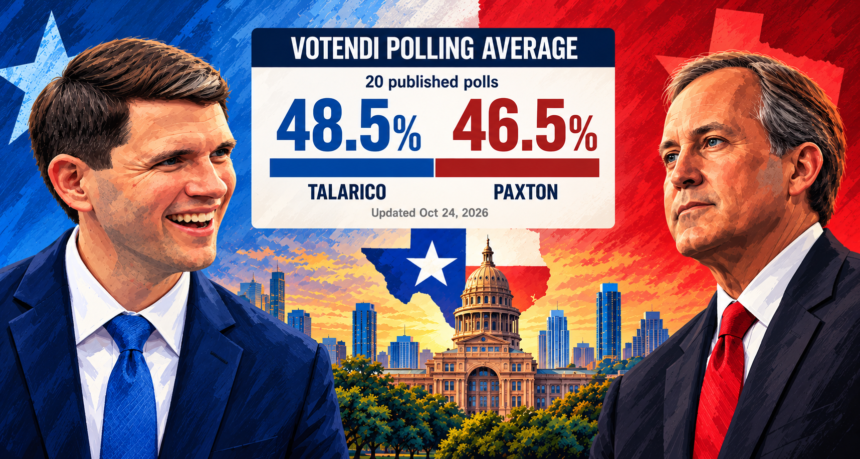
Votendi’s own polling tracker puts Democrat James Talarico at 48.5% and Republican Ken Paxton at 46.5% in the Texas U.S. Senate race, a two-percentage-point difference across 20 published surveys. The figures, checked on October 24, describe a competitive race in a traditionally Republican state—but they are a weighted polling average, not an election forecast or a poll commissioned by Votendi.
Texas is voting already. Early voting began October 19 and runs through October 30, ahead of the November 3 midterms. With the retirement of Republican Senator John Cornyn, a costly advertising campaign and unusually close public surveys, the contest has implications beyond a single Senate seat.
Votendi data: Talarico 48.5%, Paxton 46.5% across 20 polls
The Votendi Texas Senate tracker currently includes 20 published polls. Its weighted average is 48.5% for Talarico and 46.5% for Paxton, a two-point difference. The most recent surveys in the calculation have fieldwork ending October 21; the latest Rasmussen survey was published October 23 and has now been included.
Votendi combines the available published surveys using recency, sample size, pollster quality grade, methodology and editorial weight. Older findings are discounted with a 30-day recency half-life. The individual source records, fieldwork dates and interactive 7D/30D/ALL chart are available in the tracker, allowing readers to examine the underlying evidence rather than rely only on a headline percentage.
That distinction matters. Votendi did not conduct its own interviews. These percentages are an original aggregation of publicly reported polling data; they do not imply a 48.5% or 46.5% chance of winning, and the two-point difference has no single statistical margin of error.
Latest polls show why the race remains close
The latest published findings are not identical, even when surveys cover overlapping days. Here are five of the recent sources represented in Votendi’s tracker. All figures are vote-intention percentages as reported in each poll, not normalized to a two-candidate total.
| Pollster | Fieldwork | Talarico (D) | Paxton (R) |
|---|---|---|---|
| Rasmussen Reports | Oct. 20–21 | 45% | 45% |
| ActiVote | Oct. 17–21 | 51% | 49% |
| Emerson College | Oct. 17–19 | 48% | 46% |
| Fox News | Oct. 15–19 | 49% | 49% |
| Texas Public Opinion Research | Oct. 15–18 | 51% | 47% |
Rasmussen’s October 20–21 survey questioned 965 likely voters and found a 45–45 tie, with Libertarian Ted Brown on 5% and another 5% undecided. Emerson’s first-choice question gave Talarico 48% and Paxton 46%; a separate follow-up measure that asked undecided respondents which way they lean produced 49–48. Those two Emerson figures should not be mixed as if they were independent polls.
Likewise, the Texas Public Opinion Research figure reflects a final-push question asking respondents to choose, rather than the initial first-choice ballot. Differences in question wording, voter screens, fieldwork and survey methods help explain why a single poll can look more favorable to one candidate than another. The Votendi average mitigates some random survey variation, but it cannot remove every systematic bias shared by the surveys.
Brown’s role also deserves a caveat. The Votendi tracker currently shows him on a separate 2.8% average from only four surveys that explicitly included his candidacy. That measure does not use the same 20-poll base as the two major candidates, so the three displayed averages should not be added together as though they came from one uniform survey.
How a Republican stronghold became a competitive Senate contest
Texas last elected a Democrat to statewide office in 1994. President Donald Trump carried the state by roughly 13.6 points in 2024, according to RealClearPolling’s Texas race profile. Against that political history, the narrow gaps in October’s Senate polls are notable, but a statewide election remains a different test from a survey sample.
Paxton, Texas’s attorney general since 2015, defeated longtime Senator John Cornyn in the Republican primary runoff in May. He campaigns with Trump’s backing, emphasizes immigration enforcement and conservative policy priorities, and seeks to retain the seat for the Republican Party. Talarico, a state lawmaker and former teacher who has also studied at seminary, has made affordability, health care, education and government accountability prominent parts of his Democratic campaign. Libertarian Ted Brown is also on the ballot. For more detail on the candidates’ records and positions, see the Texas Tribune’s candidate issue guide.
The candidates’ backgrounds have become central to the campaign. Talarico has criticized Paxton’s legal and ethics history. Paxton was impeached by the Republican-controlled Texas House in 2023, then acquitted by the state Senate. A separate state securities-fraud case was dropped in 2024 under an agreement that included restitution and other conditions; Paxton denied wrongdoing. Paxton and his allies, in turn, have attacked Talarico’s positions on cultural and social issues, including claims about health care for transgender minors that independent fact-checkers have disputed. These are campaign arguments, not substitutes for the polling data.
Why this Senate seat matters nationally
The Senate currently has 53 Republicans and 47 Democrats or independents aligned with Democrats. Senators serve six-year terms and vote on federal legislation, executive appointments and federal judges. A change in a Republican-held seat such as Texas would alter the arithmetic of the next Senate; which party controls the chamber depends on results across multiple states, not Texas alone. The Cook Political Report classifies Texas among its competitive Toss-up contests.
Texas has consequently drawn extraordinary national political spending. Reuters reported on October 21 that advertising in the race had passed $500 million. It found roughly $239 million in spending from major Republican-aligned groups against about $45 million from major Democratic-aligned groups, while Talarico had reported approximately $64 million in third-quarter campaign fundraising. Reuters also documented substantial support for Republican-aligned spending from Elon Musk via the Senate Leadership Fund.
Those sums illuminate competing strategies, not a demonstrated electoral effect. Republicans are working to mobilize voters in a state with a historically favorable partisan baseline, while Democrats hope to assemble a broader coalition and sustain participation through early voting and Election Day.
Early voting is already underway—and turnout data need care
Texas early in-person voting runs from October 19 through October 30, with Election Day set for November 3, according to the Texas Secretary of State’s voter information site. Early-ballot figures have drawn particular attention, but turnout volumes do not reveal how voters cast their ballots.
An Associated Press review earlier this week reported a sizable rise in early voting compared with a similar point in the 2022 cycle, while warning that reporting changes and differences in voting access complicate comparisons. Houston Chronicle reporting on October 24 further documented discrepancies between county counts and some figures on the state’s election dashboard linked to data-entry delays and system issues. These should not be interpreted as evidence of how the Senate vote will break.
What to watch before November 3
Three measurable questions remain: whether new surveys reproduce the close Talarico–Paxton gap; how different pollsters treat undecided and Libertarian voters; and how reliably turnout information is reported during early voting. A two-point polling average is meaningful as a description of current survey evidence, but it is not a declaration of the result.
Follow the continually updated Votendi Texas Senate tracker for polling averages, fieldwork dates, every underlying published poll and the interactive trend chart. For the broader contest, see Votendi’s guide to seven closely contested Senate races.
Data and methodology note (October 24, 2026): Votendi’s proprietary weighted calculation uses 20 published polling records in its Texas Senate tracker; the latest fieldwork ends October 21, including the October 23 Rasmussen release. The headline percentages are not an independent Votendi opinion survey or a model of win probabilities. Poll figures may change with additional records or corrections. External reporting and official election dates are attributed and linked in the article.